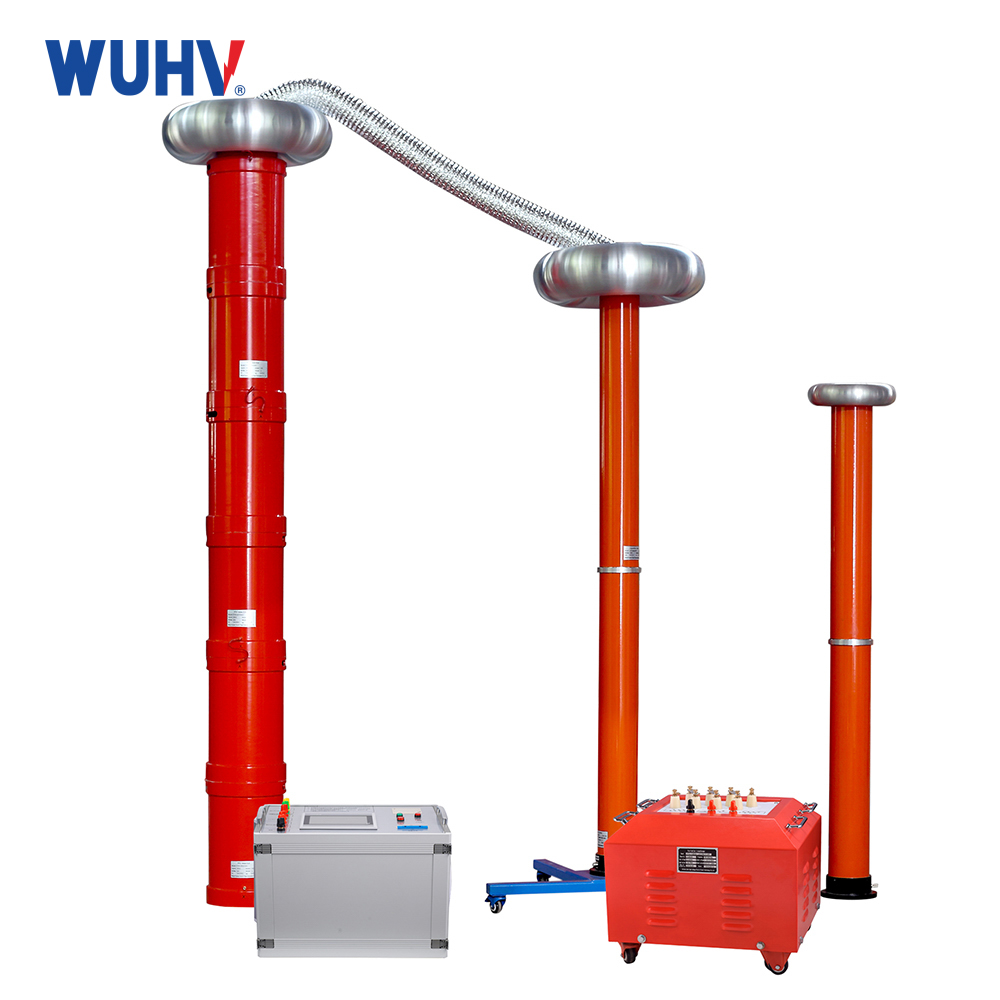
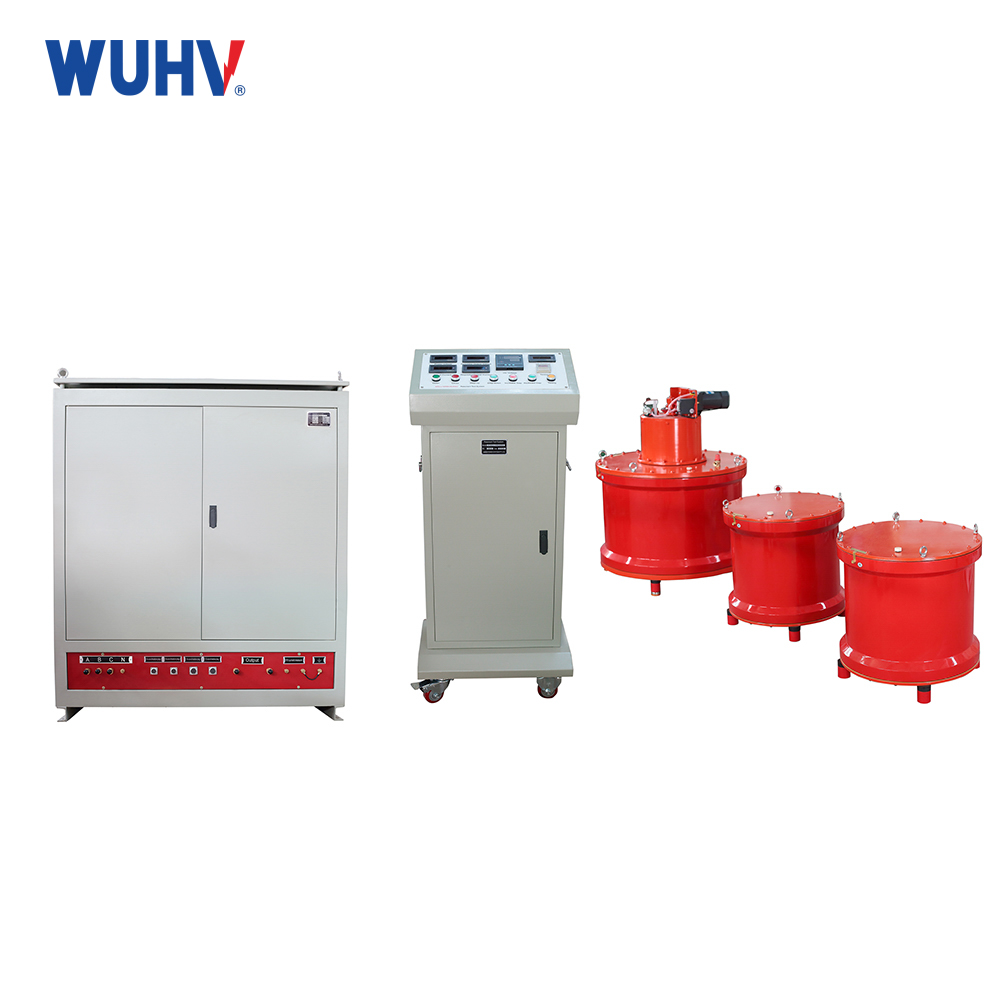
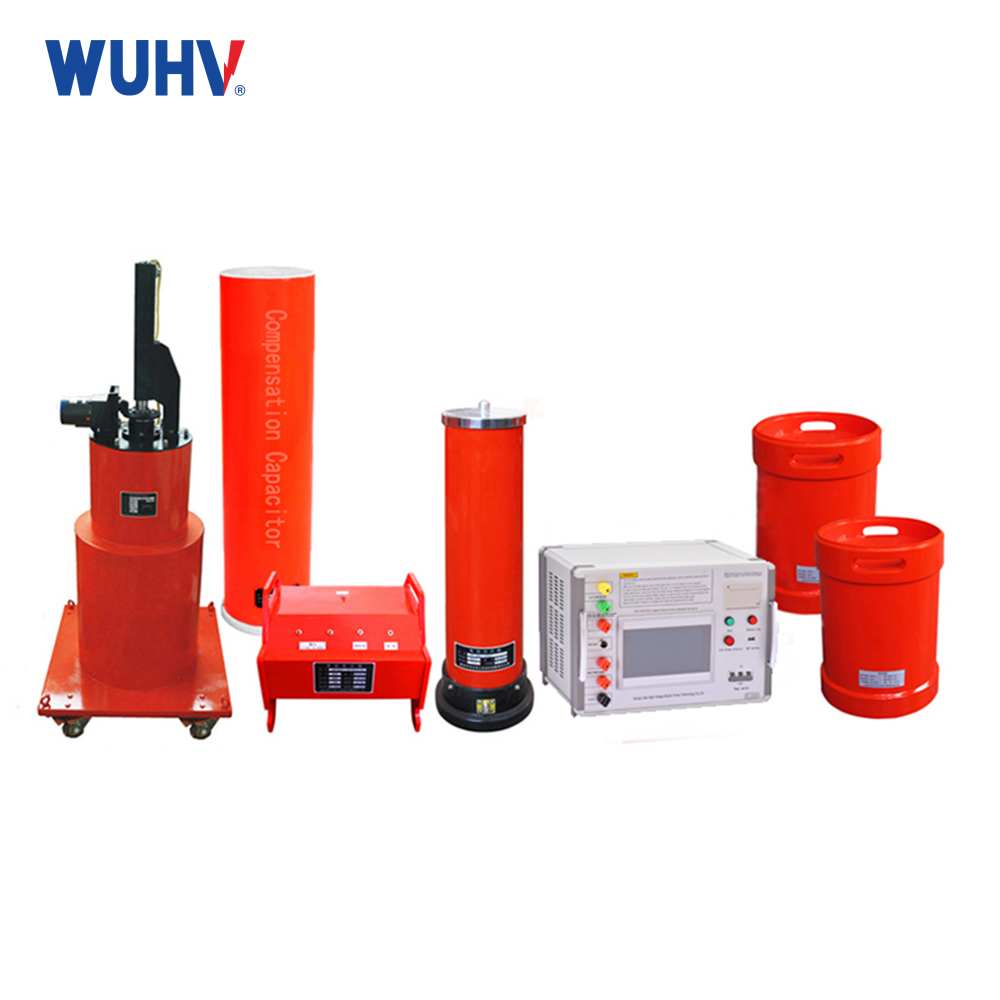
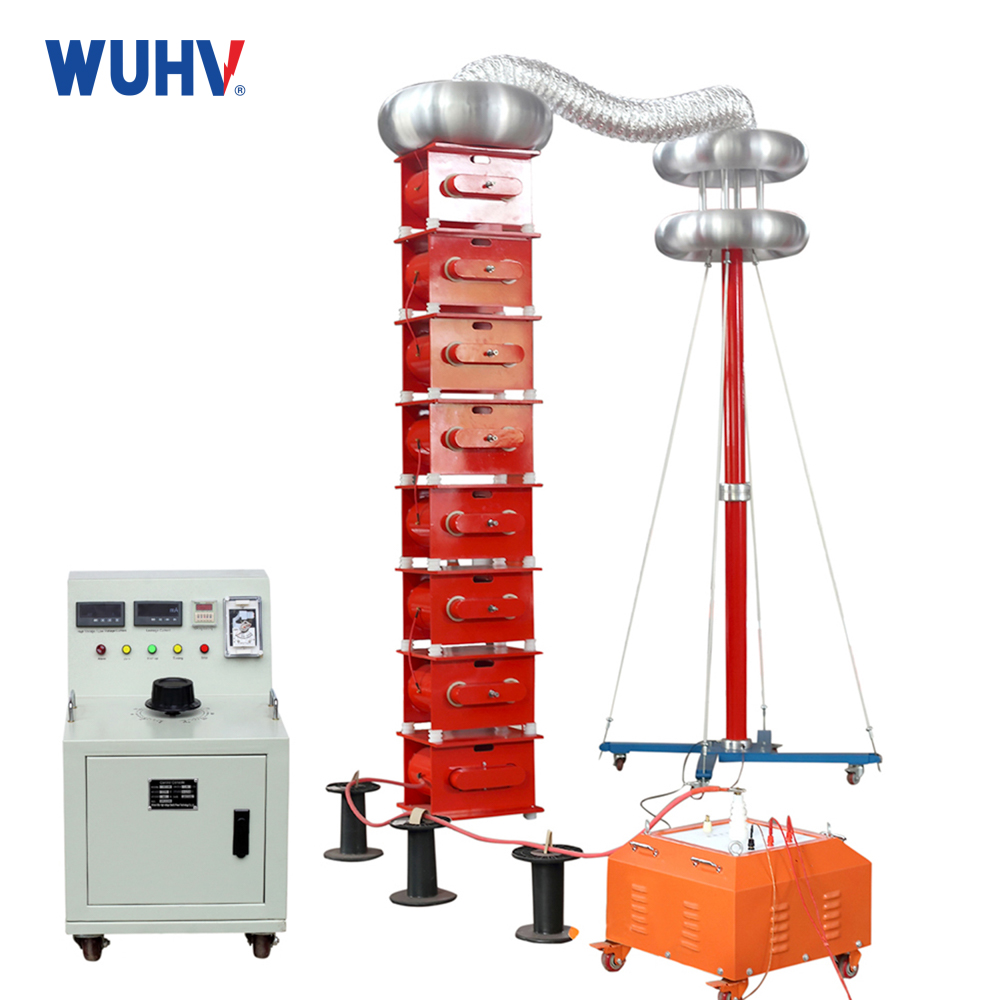
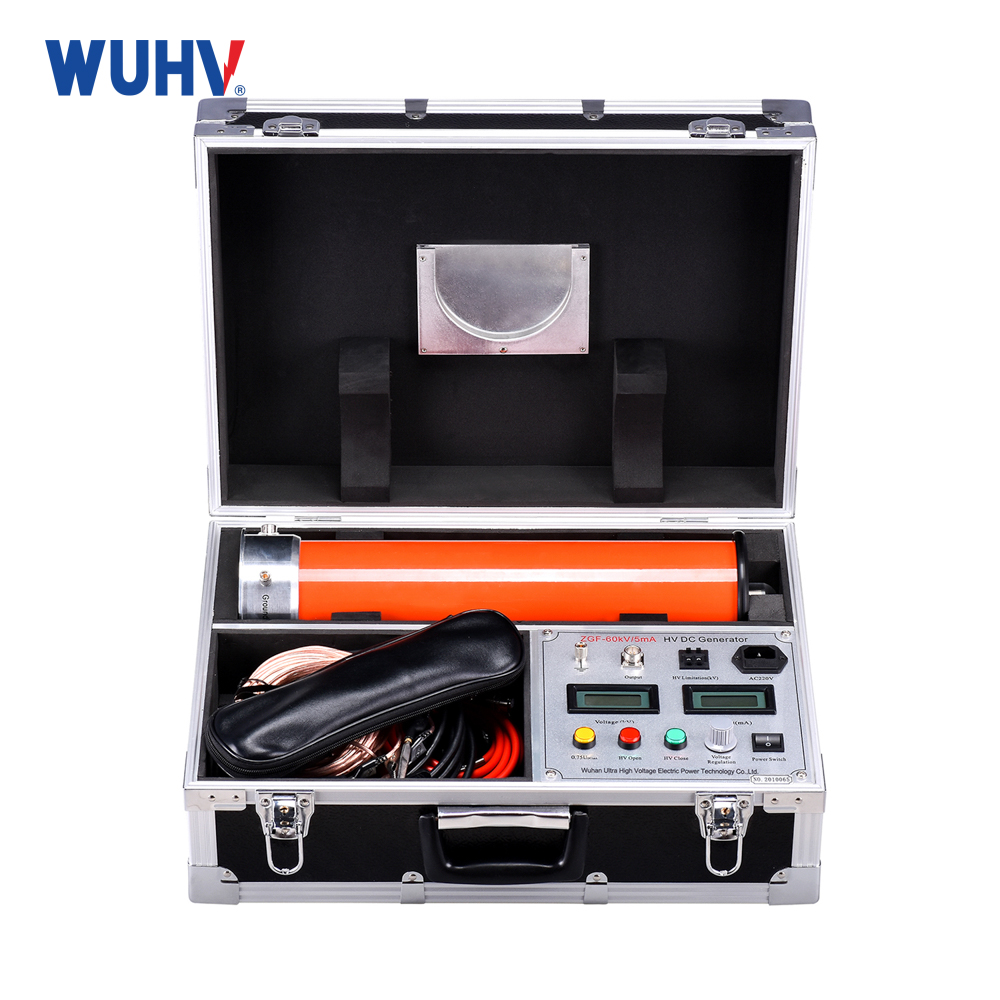
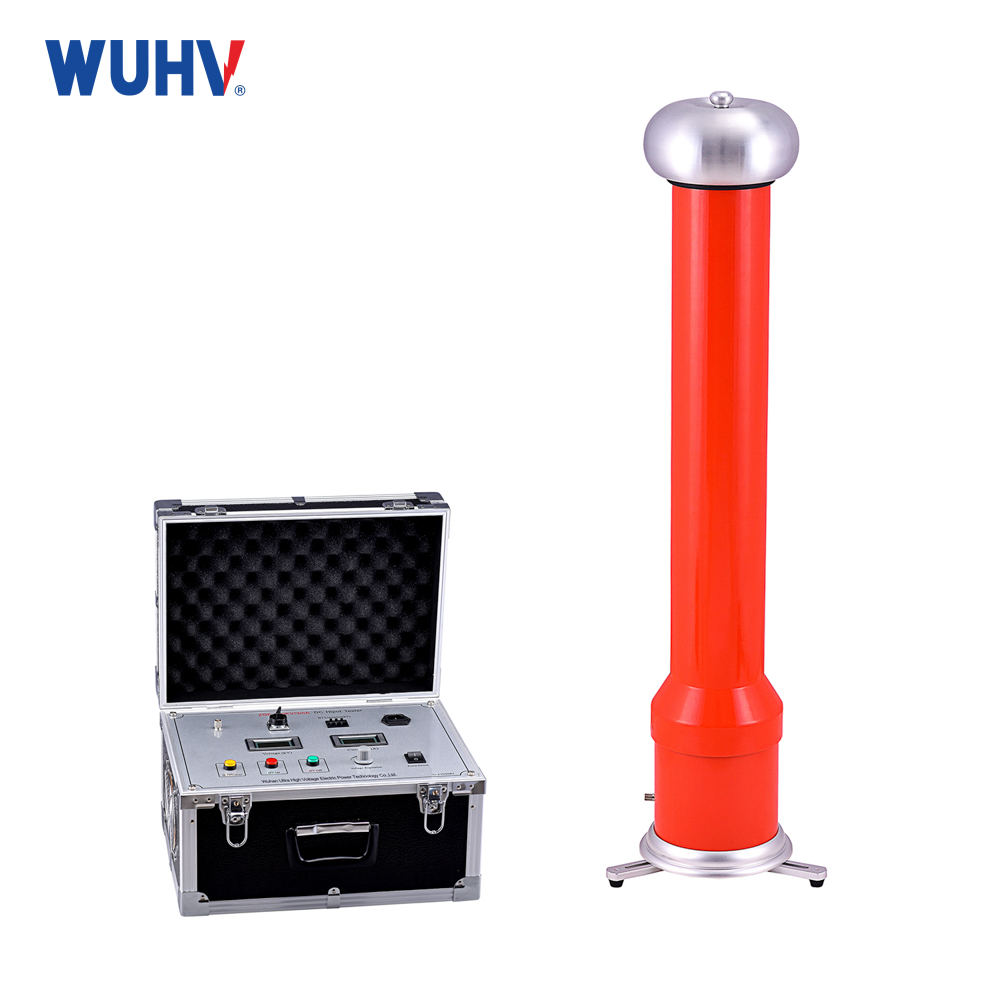
Series resonance? Wuhan UHV specializes in producingseries resonance. When looking forseries resonance, choose Wuhan UHV.
Starting from the equation analysis of the RLC series resonant circuit, the Wuhan UHV circuit experiment derived the resonant frequency, quality factor, and input impedance of the circuit in the resonant state. Based on Multisim simulation software, the RLC series resonant circuit was created, and its theoretical basis was verified using virtual instruments and simulation analysis methods, respectively. The results indicate the consistency between simulation and theoretical analysis, providing a feasible research method for the application of simulation analysis in electronic circuit design.
The resonance phenomenon is a specific working state of a sinusoidal steady-state circuit. Usually, resonant circuits are composed of capacitors, inductors, and resistors, and can be divided into series resonant circuits, parallel resonant circuits, and coupled resonant circuits according to the connection form of their components.
Due to its excellent selectivity, resonant circuits have been widely used in communication and electronic technology. For example, the phenomenon of inductor voltage or capacitor voltage being greater than the excitation voltage during series resonance has been effectively applied in the field of wireless communication technology. For example, when a radio broadcast or television receiver is tuned to a certain frequency or frequency band, the signal within that frequency or frequency band can be particularly enhanced while filtering out signals within other frequencies or frequency bands. This performance is called the selectivity of resonant circuits. So studying series resonance is of great significance.
In a series resonant circuit containing an inductor L, a capacitor C, and a resistor R, it is necessary to study the frequency characteristics of the response as a function of frequency under sinusoidal excitation at different frequencies. Multisim simulation software can achieve applications such as schematic capture, circuit analysis, circuit simulation, and simulation instrument testing. Its numerous component databases, standardized simulation instruments, intuitive interfaces, concise and clear operations, powerful analysis and testing, and reliable test results provide a reliable analysis method for many electronic engineering designers, while also shortening product development time.
Principle ofseries resonanceexperiment
The RLC series circuit is shown in the figure, and changing the circuit parameters L, C or power frequency may cause resonance in the circuit.

The impedance of this circuit is a function of the power angular frequency ω: Z=R+j (ω L-1/ω C)
Characteristics ofseries resonanceexperiment
1.The characteristics of a circuit when it is in a resonant state.
(1) The circuit impedance Z0=R, | Z0 | is the minimum value, and the entire circuit is equivalent to a pure resistance circuit.
(2) The value of the loop current I0 is the highest, I0=US/R。
(3) The value of the voltage UR on the resistor is the highest, UR =US。
(4) The voltage UL on the inductor is equal to the voltage UC on the capacitor, with a phase difference of 180 °, UL=UC=QUS。
2. Quality factor Q of the circuit
When a circuit resonates, the ratio of the voltage on the inductor (or capacitor) to the excitation voltage is called the quality factor Q of the circuit, which is:

3. Resonance curve.
The characteristics of voltage and current in a circuit that vary with frequency are called frequency characteristics, and their curves that vary with frequency are called frequency characteristic curves, also known as resonance curves. Under the fixed conditions of US, R, L, and C, there are

By changing the power angular frequency ω, a resonance curve of the response voltage as a function of the power angular frequency ω can be obtained, and the circuit current is proportional to the resistance voltage. From the graph, it can be seen that the maximum value of UR is at the resonant angular frequency ω 0. At this point, UL=UC=QUS。 The maximum value of UC is at ωω 0. The graph shows the current frequency characteristic curves at different Q values after normalization. From the graph (Q1
Conclusion ofseries resonanceexperiment
According to the results of the RLC series resonant circuit experiment conducted using Multisim simulation software, when the RLC series resonant circuit resonates, the voltage UL on the inductor and the voltage UC on the capacitor are equal in magnitude and opposite in phase. At this point, the circuit is in a pure resistance state with the minimum impedance, and the voltage of the excitation power supply is in phase with the response voltage of the circuit. The resonant frequency f0 is related to the inductance L and capacitance C in the circuit, and is independent of the resistance R and the excitation power supply. The quality factor Q value reflects the sharpness of the curve, and the resistance value of resistor R directly affects the Q value.


